Traces vs. Snapshots: Print Statements and Debuggers
by Scott Schneider
To my surprise, some programmers consider using print statements instead of debuggers as a wholly inferior means of debugging. As I view the debugging process, they are complementary techniques. But the issue is not really “print statements” versus “debuggers.” It’s traces versus snapshots.
Traces provide a long term view over a small set of data, and snapshots show all of the data from a moment in time. Or, as a figure:
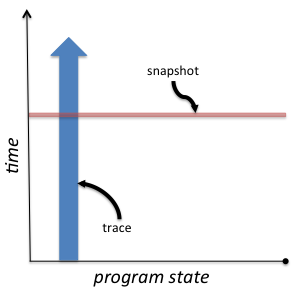
Traces
Most of my programming time is spent working on the runtimes for parallel systems. Whether it’s multithreaded memory allocation, automatic data transfers, or tracking messages in a distributed system, these all have one thing in common: they’re event based. The code I write is not the code driving the program; my code is servicing an application.
When I have bugs, they are typically algorithmic in nature. My code correctly implements my understanding of the problem, but my understanding is wrong. Rarely does a program actually crash. Segfaults are actually a relief, because diagnosing the problem will probably be easy: just fire up the debugger and find the null pointer or empty container.
Rather, most of the time, the end results of the program are wrong, and I need to figure out why. Doing so requires recording just enough of the execution of the program to be able to spot something that disagrees with my understanding of what should happen. In other words, I need a trace.
Typically, I start by instrumenting the most visible entries into the runtime system. For example, for a memory allocator, I’ll log every allocation and deallocation request. For an allocation, I’ll record the size and the memory address returned. For the deallocation, I’ll record the memory address being freed. Doing this provides me with a trace that is complete in time (it covers the whole execution of the program), but incomplete in program state (it is only for a select few values). But by having a trace, I can look forward and backward in time at my leisure, looking for aberrant behavior—say, the same memory address returned for two allocation requests without a deallocation in-between.
When tracking messages in a distributed system, I’ll log the receipt and submission of each message as they flow through the system. By looking at the traces for all of the processes in the system, I can construct the message flow and look for messages that are out of place.
I’m rarely lucky enough that these top-level traces provide enough information to find the bug. These traces are just the start, as they hint where to explore next. Do I need more data at my current level of instrumentation, or do I need to start instrumenting deeper parts of my algorithms? (Note that “instrumenting” is just a fancy way of saying “adding more print statements.”) In terms of my figure, I start with a narrow vertical slice of the program state, and selectively broaden its width as my understanding of the problem matures.
In situations like the above, a single snapshot of the entire program state is not going to show me what I need to know. A snapshot, as provided by a debugger, can tell me the entirety of the program’s state, but it cannot tell me how the program came to be in that state. I need history—lots of it. I could set breakpoints, observe the state, resume, wait for the next breakpoint, and then observe again. And sometimes, I do this. But doing this process thousands of times is not feasible—and good traces can easily reach into the hundreds-of thousands of events.
Snapshots
Of course, sometimes I still need snapshots. When a program crashes or hangs, I reach for a debugger. In those instances, I want to be able to inspect the entire system state at my leisure. Debuggers are essential for this, because it’s infeasible to log the entire system state; debuggers are interactive, and allow exploration of the system state much in the same way that traces allow exploration of algorithmic behavior over time.
Sometimes I’ll even reach for a debugger after spending a long time inspecting traces. If I can spot where things go wrong in a trace, but I’m already at the finest granularity of logging possible, then I start to suspect system issues like memory corruption. But in such a case, traces showed me where to look. I never would have been able to discover exactly where in my program to point the debugger without the trace. (I’m assuming, of course, that this is the kind of memory corruption that valgrind cannot find.)
Debuggers are for when I have started to question even the most fundamental of operations, and I need to observe exactly what is happening at a point in time. In fact, I can rely on traces because I already have a good idea of what the system is doing at all points of the program. When I use traces, what I question is not the system itself, but my algorithms that run on top of it. Once I start to suspect the system itself, I reach for the debugger.
A Mental Model
Whether using traces, snapshots or both, the purpose is to build a mental model of what your program is actually doing, because your current one is wrong. (If it wasn’t, you wouldn’t have a bug.) Knowing the entire state of your program during its entire time of execution is not realistic for interesting programs. So we investigate sections of the state-time space. And, in general, we want to look at slices that cover all of one of those dimensions. If I’m confident that a particular value is involved in an error, then I want to see all of those values, over all time—a vertical slice, a trace. If my view of the state-time space does not cover all time, then there’s always the possibility that the error is lurking somewhere in the times I did not cover. If I’m confident that an error occurs at a particular moment in time, then I want a horizontal slice, a snapshot, so I can observe all values across that moment.
If you ever find yourself producing single-line traces where you keep adding reported values, you don’t want a trace. You want a snapshot, and a debugger is the better tool. If you ever find yourself setting breakpoints in a debugger, writing down values, letting it run until the next breakpoint and again writing down values, then you don’t want a snapshot. You want a trace.